2026 Author: Howard Calhoun | [email protected]. Last modified: 2025-01-24 13:10:30
Technical analysis has incorporated a large number of repetitive patterns of price movement. Some of them have proven themselves better than others as a source of forecast. One of these models is the flag or pennant. A correct understanding of this pattern can be the basis for many profitable strategies.
What does the flag pattern mean in technical analysis
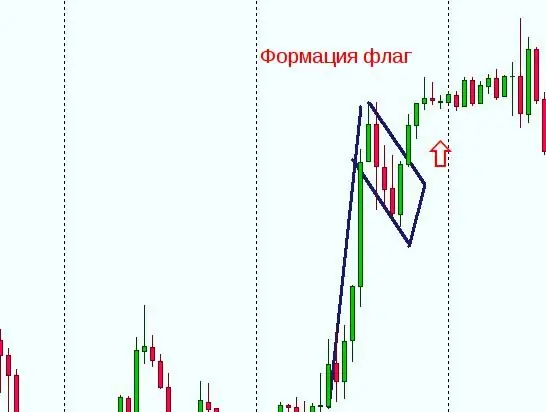
On technical analysis charts, you can often see a graphic formation that looks like a flag or a pennant. This pattern is characterized by a sharp forward movement, stopping the price at a certain level and then moving in a narrow price range.
What can this pattern say? Classical analysis interprets it as a trend continuation pattern. If the impulse movement that formed the flagpole was bullish, then the price, having gone beyond the subsequent consolidation, will continue to move in a bullish direction. In the case of a bearish flag, the price exits the trade in a bearish direction.
How to identify a flag by its appearance
The flag pattern can have a different appearance. Sometimes it's obvious, sometimes it's not. In the event that the flagpole is formed by one large candlestick, the model stands out well on the chart. But there are times when the shaft is formed from several medium-sized momentum candles.

This design is harder to identify. Here it is necessary to give a clear definition of when a figure can be called a flag in technical analysis. If the price movement that forms the flagpole is 60-90⁰ relative to the horizontal, then this can be defined as a pole. A little explanation needs to be made here. Depending on the timeframe, this movement will look different. Let's say if a pole is found on a four-hour chart and looks according to our requirements, then on an hourly or 15-minute timeframe everything will look different. The angle will be much flatter, in addition, rollback designs will not allow identification of the model as a flag.
The next requirement, which will help to clearly define what this flag is, is the occurrence of consolidation at the next significant price level. That is, if the price went in a certain direction, but did not reach the next resistance or support level, then it is impossible to say that this is a flag. Even if the price movement was at the right angle.
The next thing to define the pattern is the form of consolidation. It should have price fluctuations in a small range. In this case, the extremes of these fluctuations should be parallel to each other bytime period: high and low should not go beyond the price corridor. If this happens, then this indicates a possible price breakout for one of the consolidation levels and the beginning of the next movement.
Another variation of the flag pattern is the pennant. Its difference lies in the shape of the consolidation zone.

If the flag is rectangular, then the pennant has a triangular trade. The amplitude of the price movement decreases with the appearance of each new candle. In Price Action, this formation is called a spring. Accumulation occurs: at a certain moment there is a rapid increase in volumes, and the spring shoots. The price starts moving again.
How the flagpole is formed
Any price movement with the subsequent formation of graphic structures is due to the mood of market participants. Most often, flags appear at moments of strong news release, such as the publication of business activity indexes, changes in interest rates, speeches by the heads of large banks. Such events are marked in economic calendars with three heads, emphasizing their importance. When learning to trade, the emphasis in fundamental analysis is on such news.
Often, in anticipation of news, the market freezes and moves in a narrow price range for a certain time. At the time of publication of the news, market participants place many orders to buy or sell. If the volumes to buy significantly exceed the volumes of sell orders, then there is a rapid rise in price. The higher the difference involumes, the faster growth will occur.
Of course, news comes in different strengths. The more significant the event, the longer the period of time it has an impact. For example, on August 31, 2005, when the aftermath of Hurricane Katrina was published, the US currency fell by more than 400 points within three days. Less significant events can affect the price only within one trading session.
Summarizing, the stronger the expectations of the market players, the stronger the momentum that forms the flagpole.
Appearance
The flag itself appears as a momentum correction. This formation can be explained by the following reasons:
- Waiting for a reversal from the level of support, resistance. When approaching a significant level, traders expect either a reversal or a continuation of the price hike. This is the so-called period of uncertainty, when many people close positions, which stops the price.
- Opening deals in the opposite direction. If the volume of these positions exceeds the volume of transactions that formed the impulse, the price will reverse.
- Confusion by a large player (market maker) of small participants. At this moment, the “crowd” either closes positions or opens in the opposite direction.
- Testing the level price. If it is broken as a result of this trade, then the price will start to move further.
It's good when a trader who uses technical analysis of financial markets in his work knows the reason that formed the pattern. This allows you to understand the logic of further price movement.
Pattern on a bullishmarket
If we take the classics of technical analysis, then the bullish flag should be directed in the direction opposite to the impulse movement. That is down. But, as practice shows, often a corrective movement occurs sideways, moreover, if the trade is directed upwards, then the pattern intensifies in this case, and the likelihood of its breaking through to the bullish side increases. However, in some cases, the direction of the flag up may mean the beginning of a smooth turn. Therefore, you need to look at the direction in which the price exits the consolidation.
The most important thing in the flag pattern is not its direction, but the price movement in the side channel, beyond which will mean a new growth.
Pattern in a bear market
The bearish flag, according to the classics, looks like an upward correction after a bullish bearish move. Unlike the bullish pattern, the main thing here is going beyond the lower limits of the price channel correction.

To definitely identify that an exit has occurred, you need to wait for the price to fix outside of the consolidation.
How to calculate where the price will go
In order to use the development of the flag pattern on Forex, you need to be able to calculate the amount of price movement after exiting the consolidation. Two methods can help with this:
- A simple way of calculating is to postpone the distance traveled by the price during the formation of the flagpole from the level that was formed during the correction after the price breaks through the flag. The resulting level will be the target of fixationarrived. That is, this calculated point will show where to set take profit.
- The second method is more complicated and uses the Fibonacci grid in the calculations. This method takes into account the depth of the correction that forms the flag figure in technical analysis. You need to stretch the net on the flagpole. This will represent 100% of the original move. Then you need to observe to what level the movement will be corrected. In this pattern, the correction is rarely more than 61.8%. Profit target will be set depending on the level. With a correction from 23.6% to 61.8%, take profit is set at 161.8%. If the correction dropped to the level of 78.6%, then the price hike is expected to be up to 127%. As in the previous version, you need not just build on the correction. The main condition is the breakdown of the price channel.

How to secure a trade when working with a pattern
The flag figure in technical analysis does not always work out the mathematical expectation assigned to it. Therefore, you need to use the methods of fixing a possible loss - placing a stop order.

Besides, when the price moves in the right direction, it is necessary to transfer the deal to breakeven by dragging the stop loss level. Another method that helps reduce risks is to close half of the trade volume when it reaches a profit equal to the stop loss. This method is called “Safe”.
If the rules for opening a deal are followed when working on a trading strategy, then you can almost always count on the price moving in the right direction. Oftenthe initial momentum is 7-15 points. Naturally, the trader wants to take the maximum from the movement. However, the market can reverse at any moment.
According to the “Safe” rule. either two transactions of the same volume are opened, or one, which, upon reaching the value of the stop order, will be closed by half. If two trades are open, then one of them is closed. For example, opening a deal with a volume of 1 lot to sell at a price of 1.2981, set a stop loss at 1.2994. The stop will correspond to 13 points. Let's add to them a spread of 2 points (each currency pair will have its own spread), taken by the broker. As a result, we get 15 points. This will be the minimum profit that the initial impulse will give. Therefore, to secure the trade, we open a stop order that closes it by half, that is, 0.5 lots, at the level of 1.2966. Now, when this level is reached, half of the trade will be closed, and a profit of 15 points will be fixed. And since the stop loss is also equal to 15 points, if our forecast is not justified and the price reverses, half of the transaction will close in a minus equal to 15 points. Loss and fixed profit will equalize each other, as a result of which the erroneous forecast will close without a loss.

However, if the movement is in the predicted direction, then take profit, set according to fibonacci levels, will allow taking profit. well over 15 points.
Technical analysis of financial markets does not give a 100% guarantee, just like the fundamental one. It is assumed that the price hike when the flag is broken will bebe at least 70% of the size of the flagpole. However, this probability decreases if the correction that occurred after the impulse. will be extended over time. The longer it lasts, the weaker the pattern becomes. We can say that the formation cycle of the flag figure directly affects the mathematical expectation of this graphical model.
Always remember that this is a breakout construct: you can't go in just because it looks right. You need to wait for the breakdown of the channel boundaries with subsequent consolidation, only after that enter the deal.
An additional confirmation of the movement along the trend will be an increase in volumes. Volume indicators are available in any trading terminals. Even though there are no true volumes of trades on Forex, tick volumes also do a good job of this task. They show the number of price changes over a period of time. It is believed that the more ticks occurred, the higher the volumes flow. And this is true, because for each price change, a certain volume is needed.
Strategies with the flag
How to use the flag pattern in Forex? Several strategies have been developed for this. One of them is called “Flag + ABC”. Its essence boils down to the following:
- After the impulse movement occurs, you need to wait until the price starts moving in the side channel.
- The first pullback movement after the impulse will be called the “A” wave. The second wave, which will form the opposite border of the channel, will be called “B”. The third wave that moves in the direction of the pullback will be “C”. It is shewill indicate that the flag has been generated.
- After the end of wave “C”, you can enter the trade in the direction of the initial impulse.

How can you understand that wave “C” has ended? There are several ways to do this. The simplest is to draw a trend line from point “B” in the direction of wave “C”. The breakdown of this line will indicate the beginning of a new movement. In addition, the end of the wave can be indicated by divergence that occurs on such indicators as RSI, MACD.
Often pullback comes to 38-61.8% of momentum. This may indirectly indicate the end of wave “C”. However, if the correction is deeper, then you should think about whether the resulting model should be attributed to the flag? It is possible that the price forms one of the varieties of Gartley patterns.
The level for the first target will be the outer border of the consolidation channel. You need to set take profit on it. The second target will be at 138% of the original impulse. The deal is already opened when the channel is broken. The rule for breaking the flag pattern on Forex is that the price goes beyond the limits of consolidation and starts a hike in the direction of the impulse that formed the flagpole. Either the price returns to the retest of the level of the consolidation border, and only after that the further price hike in the right direction begins. The main task of a trader is to wait for confirmation.
Where to put stop loss according to the strategy? Orders that limit losses in case of an incorrect forecast on the Forex market are placed behind local minima or maxima. If you givean order to make a deal after the end of wave “C”, you need to set a stop loss, then it must be placed below (in the case of a bullish pattern) or above (in the case of a bearish pattern) point “C” by several points. Their number will depend on the timeframe on which the flag graphic formation appeared. If it's a 4-hour chart, then 15-20 four-digit points will suffice, which corresponds to 150-200 five-digit points. On the hourly chart, stop loss can be set at 5-10 points from the extreme.
If, when calculating take profit and stop loss, we start from fibonacci lines, then an order limiting losses can be placed below the fibonacci line (in the case of a bullish flag), to which the rollback has reached. That is, if the rollback has reached the level of 50%, then the stop loss can be hidden behind the level of 61.8%. If the price has reached 61.8%, then the stop order should be placed below 78.6%. However, if the rollback has reached 78.6%, then, most likely, the flag figure will not be worked out.

Conclusion
Learning to trade is not an easy process. Many failed traders have come to the conclusion that Forex is a scam or that technical analysis doesn't work. Indeed, many of the techniques used in the last century work with a small degree of probability. But this does not apply to the technical analysis flag pattern. In most cases, it can serve as a reliable method for price prediction.
Recommended:
Fundamental market analysis. Technical and fundamental analysis
Fundamental analysis is a set of methods that allow predicting events in the market or in its segments under the influence of external factors and events
Technical analysis for beginners: where to start?

Recently, the popularity of trading on various exchanges has been growing. There are all sorts of markets and tools, but the principles of work are the same everywhere. This article will tell you about technical analysis for beginner traders
Head and Shoulders pattern: concept, technical analysis, trading, psychological model of market players
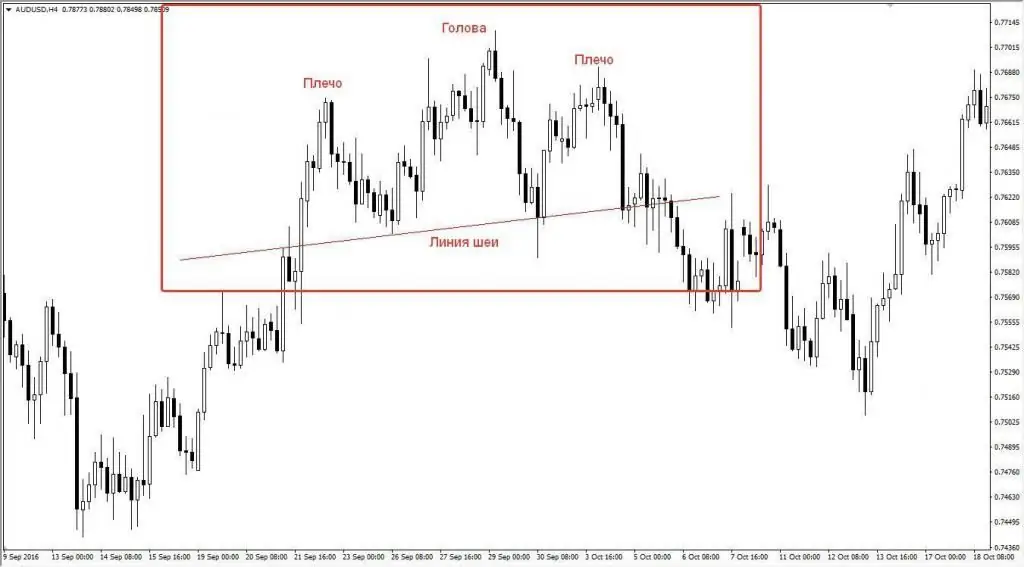
Technical analysis of financial markets includes many models that can predict future price movements. The Head and Shoulders pattern is one of those. Despite its more than three hundred years of history, it is still a reliable tool
Technical passport for home: how and where to make? Terms of production of a technical passport for the house

One of the main documents related to real estate is a technical passport for a house. It will be needed to carry out any transaction, and is manufactured at the BTI at the location of the facility. How much does it cost, what documents need to be collected, as well as the validity of the registration certificate and other nuances in more detail in the next material
Technical analysis of "Forex" (market). What is the summary technical analysis "Forex"
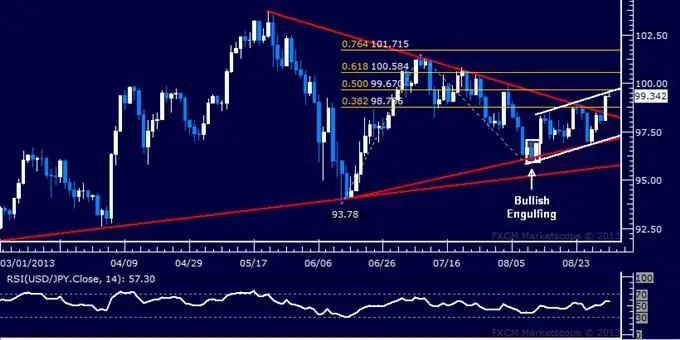
The Forex market has become very famous in Russia in a short time. What kind of exchange is this, how does it work, what mechanisms and tools does it have? The article reveals and describes the basic concepts of the Forex market

