2026 Author: Howard Calhoun | calhoun@techconfronts.com. Last modified: 2025-01-24 13:10:28
Work planning always begins with determining the number of tasks, the persons responsible for their execution and the time required for complete completion. When managing projects, such schemes are simply necessary. Firstly, in order to understand how much total time will be spent, and secondly, to know how to plan resources. This is what project managers do, they primarily carry out the construction of a network diagram. An example of a possible situation will be considered below.

Initial data
The management of the advertising agency has decided to release a new advertising product for its clients. The following tasks were set before the employees of the company: to consider the ideas of advertising brochures, to give arguments in favor of one or another option, to create a layout, to prepare a draft contract forclients and send all information to management for consideration. In order to inform clients, it is necessary to conduct a mailing list, put up posters and call all the firms in the database.
In addition, the chief executive made a detailed plan of all necessary actions, appointed responsible employees and determined the time.
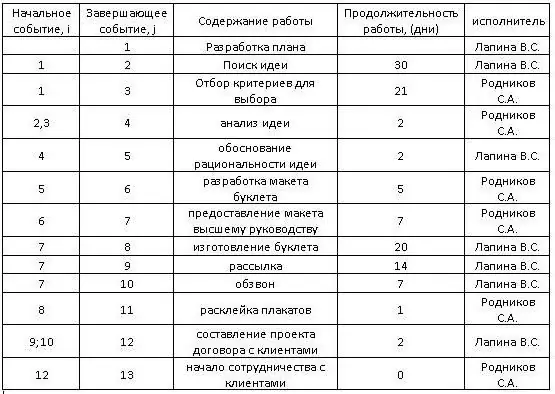
Let's start building a network graph. The example has the data shown in the following figure:
Building a matrix
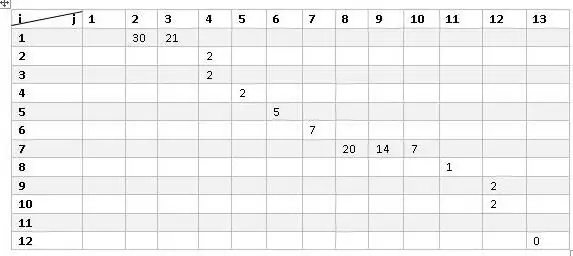
Before you create a network diagram, you need to create a matrix. Graphing starts from this stage. Imagine a coordinate system where vertical values correspond to i (start event) and horizontal rows to j (end event).
Starting to fill in the matrix, focusing on the data in Figure 1. The first job has no time, so it can be neglected. Let's take a closer look at the second one.
The initial event starts from number 1 and ends at the second event. The duration of action is 30 days. This number is entered in a cell at the intersection of 1 row and 2 columns. In a similar way, we display all the data that is shown in the figure below.
Basic elements used for a network diagram
Graphing begins with the designation of the theoretical foundations. Consider the main elements required to compile the model:
- Any event is indicated by a circle, in the middle of which there is a number corresponding toorder of operations.
- The work itself is an arrow leading from one event to another. Above the arrow they write the time required to complete it, and under the arrow they indicate the responsible person.
A job can run in three states:
- Action is an ordinary action that requires time and resources to complete.
- Waiting is a process during which nothing happens, but it takes time to move from one event to another.
- Dummy work is a logical connection between events. It does not require any time or resources, but in order not to interrupt the network schedule, it is indicated by a dotted line. For example, the preparation of grain and the preparation of bags for it are two separate processes, they are not connected sequentially, but their connection is needed for the next event - packaging. Therefore, another circle is selected, which is connected by a dotted line.
Basic principles of construction
The rules for constructing network diagrams are as follows:
- All events have a beginning and an end.
- Only the arrows can not go to the first event, and only from the last one they can't go.
- All events, without exception, must be connected by sequential work.
- The chart is built strictly from left to right in sequential order.
- Two events can only be connected by one job. You can not put two arrows; if you need to do two jobs, then enter a fictitious one with a new event.
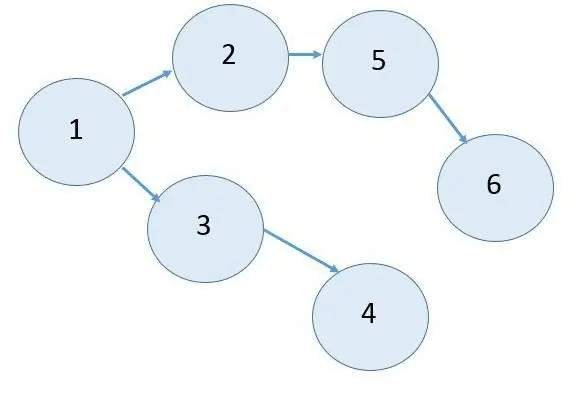
- There must be no dead ends in the network. Do not allow the situation shown in the figure3.
- Cycles and closed loops must not be allowed to form.
Building a network graph. Example
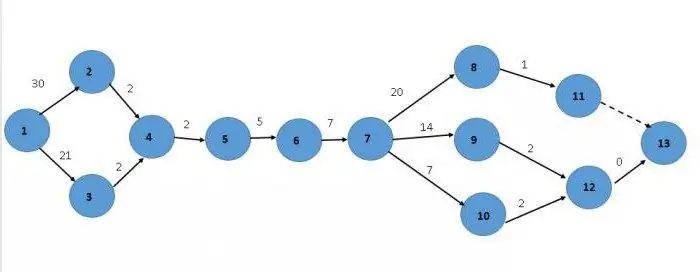
Let's go back to the original example and try to draw a network graph using all the data provided earlier.
Starting from the first event. Two come out of it - the second and the third, which unite in the fourth. Then everything goes sequentially until the seventh event. Three works come out of it: the eighth, ninth and tenth. We will try to display everything:
Critical values
It's not all network plotting. The example continues. Next, you need to calculate the critical moments.
The critical path is the longest time taken to complete a task. In order to calculate it, you need to add up all the largest values of successive actions. In our case, these are works 1-2, 2-4, 4-5, 5-6, 6-7, 7-8, 8-11. Summarize:
30+2+2+5+7+20+1=67 days
Thus, the critical path is 67 days.
If this time for the project does not suit the management, it should be optimized according to the requirements.
Process automation
Today, few project managers draw diagrams by hand. A network diagramming program is a simple and convenient way to quickly calculate time costs, determine the order of work and assign performers.
A short look at the most common programs:
- Microsoft Project2002 is an office product in which it is very convenient to draw diagrams. But doing the calculations is a little inconvenient. In order to perform even the simplest action, you need a considerable amount of knowledge. When downloading the program, make sure to purchase the user manual for it.
- SPU v2.2. Very common free software. Or rather, not even a program, but a file in an archive that does not require installation to use. It was originally designed for a student's graduation thesis, but proved to be so useful that the author posted it online.
- NetGraf is another development of a domestic specialist from Krasnodar. It is very easy, easy to use, does not require installation and a huge amount of knowledge on how to manage it. On the plus side, it supports importing information from other text editors.
- You can often find such an instance - Borghiz. Little is known about the developer, how and how to use the program. But by the primitive method of "poke" it can be mastered. The main thing is that it works.
Recommended:
Motor oil production: characteristics, technology and manufacturing process

The production of motor oil, like any other, is not complete without raw materials - the substance from which the final product is obtained. Mineral oil is made from petroleum. But before it gets to the lubricants plant, it needs to go through a series of cleanings at oil refineries
The model is functional. Model building "as is" and "as will be"

The desire to achieve concretely significant targets: products, services, socially useful activities - is understandable and justified, but a specific achievement plan always turns into a really accessible one. An organization as a living organism is a system of organized information processes coming from outside, circulating inside, created as a result
Sheath - what is it? Manufacturing process

Sheath - what is it? For an ordinary person, this word will certainly arouse interest. It's completely unclear what it means. However, this thing is very necessary in any production. It is easy to make it if you have the necessary skills. So, answering the question, the shell - what is it, it should be said - is a blank that is used to create cylindrical and conical structures. It is made from sheet metal by welding
How to get a land plot for the construction of a residential building? How to choose a land plot for building a house?

It is not so difficult to get a land plot for the construction of a residential building if you know exactly how to do it
Three-phase network: power calculation, connection diagram
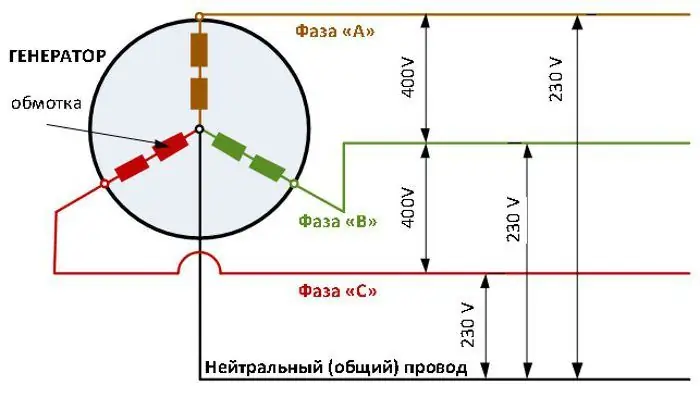
When properly designed and maintained, a three-phase network is ideal for a private home. It allows you to evenly distribute the load across the phases and connect additional power consumers, if the wiring section allows

