2026 Author: Howard Calhoun | [email protected]. Last modified: 2025-01-24 13:10:35
Support and resistance levels are important concepts in the foreign exchange market, the awareness of which not only allows you to see graphical figures, but also helps in determining the trend. Evaluation of the strength of these levels becomes a weighty basis for predicting the trend and for determining its reversal point.
What is a support level?

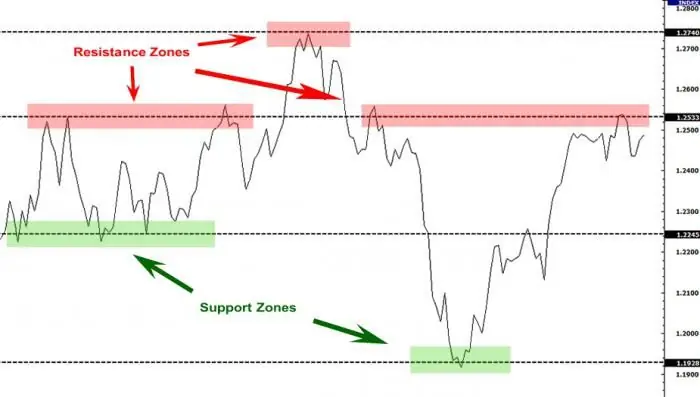
Support level, support, or Support, is a price indicator, strong buy positions are gathered within it, which can not only stop the downtrend, but also turn it in the opposite direction. When a downtrend reaches support, it is like a diver who, reaching the bottom, repels himself from it. The level on the chart has a horizontal position. Levels are formed if horizontal lines are drawn through the price consolidation areas. The line is below the price and will be support, it is there that the sellers cannot overpower the buyers. Quite often it happens that support and resistance levels are reversed, so the definition of support as a level becomesrelevant to resistance. Levels increase in strength as prices bounce off them.
What is a resistance level?

The level of resistance, resistance, or Resistance, is a price indicator, on the basis of which a fairly large number of sell positions are concentrated. They are enough not only to stop the uptrend, but also to reverse it. As soon as the price reaches resistance, it bounces off it and turns in the opposite direction. Resistance can be either horizontal or almost horizontal. It is most effective to build support and resistance levels in the extreme parts of the consolidation areas, or Congestion Zones. The use of maximum and minimum price indicators for this purpose is not very effective. The outskirts of consolidation zones make it clear where strong market participants have changed their minds. Local lows and highs are just a panic of small traders. A strong resistance level, in fact, as well as support, causes a trend reversal. Weak levels only stop the trend. Traders in most situations sell assets when prices hit resistance and buy when prices hit support.
What forms the levels?
Before you can identify support and resistance levels, you need to understand that these are the prices at which most of the buying or selling in history was made. Traders, memorizing highs and lows, when they are repeatedreaching the market again, without hesitation, open positions to buy or sell. These are peculiar key moments that have shown themselves well in history. In the hope of getting a guaranteed profit, all participants are waiting for a certain price value, from which a strong movement was observed earlier. We can say that the development of the lines depends to a greater extent on the traders themselves and on the actions that they perform within a certain range.
Determining levels
Support and resistance levels are key areas where there is a balance between buyers and sellers, where the forces of supply and demand are balanced. In the financial market, with an increase in supply, a falling trend is formed, and with an increase in demand, a growing trend is formed. In a balanced supply and demand format, you can observe a side trend, price movement in a certain price channel. Support will be located in the area where the demand for a trading asset is formed, which does not allow its price to fall. From a logical point of view, the phenomenon is explained very simply. As soon as the price drops to a certain level, buyers become interested in buying. At the same time, sellers are running out of strength to move the price down.

Resistance tends to be the opposite. If you look at the technical side of the issue, then the support and resistance levels for each day are the places where the largest number of buy and sell orders are concentrated, which work immediatelycorrect movement. We can say that support and resistance are lines that connect highs and lows of the same price.
Trading range
There are situations when the construction of support and resistance levels must be carried out simultaneously, as they are formed in parallel, creating a certain trading range, or Trading Range. It is also known as the consolidation zone. In technical analysis, the phenomenon is known as a certain figure - a rectangle, indicating the continuation of the trend. There is a high probability that prices will be fixed in this range for quite a long time. This is due to a large concentration of orders for both buying and selling at the corridor boundaries. The exit of the asset price outside the corridor is a very significant signal for the trader.

When the price fixes behind the support line, a strong downtrend begins. When the consolidation occurs above the resistance level, then it is time to follow the uptrend. The correct definition of support and resistance levels in tandem with other signals, such as an increase in volume or the formation of a gap, makes it possible to jump into a trend at the very beginning.
Flowing the support level into resistance and vice versa
One of the basic rules of technical analysis says that after breaking through the resistance level, the latter turns into support, and when the support is broken, it becomes resistance. The breakout of resistance indicates the formation of a large demand for a certain trading instrument in the market, which is reflected in the form of price growth. It is highly likely that when the price drops to this level again, buyers will become active and will again push the chart up.

When the support line is broken, the situation is reversed. Supply exceeds demand, causing prices to fall. When the price reaches the broken level, sellers will again begin to act actively. This pattern of behavior of trading assets is known as a level retest. It is often used in trading strategies. Trading from support and resistance levels in this format is attractive with minimal risks and fairly high profits.
Zone definitions

It is important to note that technical analysis is not an exact science. The final decision of most traders is based on subjective judgments and assumptions. Moreover, in practice, highs and lows that are identical in height are quite rare. That is why traders learn not only how to determine support and resistance levels, but also work with such a concept as zones, which can be called price reversal ranges. The use of zones and levels is determined by each specific situation. Experts recommend working with horizontal lines if prices move in a narrow range for no more than two months. Level zones are relevant where the range is widemovements
Indicators
Support and resistance don't have to be built on your own. There are many technical analysis tools that can do this job for the trader. For MT4 and MT5 terminals, there are a huge number of tools that independently draw support and resistance levels for each asset. A forex indicator that works with "mono" levels can be found in the public domain on the Internet, and it is activated by installing it in the terminal.

When working with these applications, it is worth remembering that levels never make predictions, they are formed based on history. Thus, there is the same probability of both south and north price movement. Using supporting signals such as volumes, COT reports, spot market trades and more will help determine direction.
Most popular level indicators
There are a huge number of indicators on the Internet, it is worth getting acquainted with the most popular of them:
- ACD builds levels automatically based on the formed price channel. The indicator gives a clear understanding of the trend and market conditions.
- Countback line draws lines of two colors: blue and red. Calculations are based on price chart highs and lows.
- Distributive Pricing works great on the H1 timeframe. The indicator draws indications of the price impulse in the format of two red lines, which give signals to enter themarket.
- Grid Builder builds psychological levels. More often the price bounces off the indicator lines, breaks them much less often.
The main disadvantage of such indicators is that when the trading time period changes, the levels are completely redrawn as well.
How to determine how strong a level is?
A trading strategy at support and resistance levels is based on an analysis of the strength of those very levels. According to one of the Forex classics Murphy, the level will be the stronger, the longer the prices fluctuated in its range. Strength increases as volumes increase and as the level is used for longer. Elder considers the level as strong or weak depending on how many times the price has touched it. The opinions of well-known traders differ in terms of building levels. Thomas Demark talks about building levels by reference points, while Schwager is guided by highs and lows when building horizontals. It is widely believed among the classics that it is not enough to know how to build support and resistance levels. You need to work with key zones, areas near the levels. Despite the difference of opinion, each of the theorists is a successful trader in the market.
Conclusions
Trading from support and resistance levels without the use of auxiliary instruments, even if the lines are perfectly drawn, will not bring a positive result. Levels are just price values from which a strong movement is expected. Probability of price movement up or downhas a 50/50 ratio. Without auxiliary tools, trading turns into roulette. At the same time, it is worth considering that it is the support and resistance lines that underlie numerous profitable trading strategies.
Recommended:
Best support and resistance indicator for MT4

This article will tell you what support and resistance level indicators are, and why it is better to determine them yourself
Heat resistance and heat resistance are important characteristics of steels

Ordinary structural steels, when heated, abruptly change their mechanical and physical properties, begin to actively oxidize and form scale, which is completely unacceptable and creates a threat of failure of the entire assembly, and possibly a serious accident. To work at elevated temperatures, materials engineers, with the help of metallurgists, created a number of special steels and alloys. This article gives a brief description of them
Support and resistance level. How to trade support and resistance levels correctly?

Support and resistance levels are the dominant concepts of the technical analysis of the foreign exchange market. Based on them, a large number of trading strategies have been developed, despite the fact that the lines belong to the category of inaccurate instruments
Geodetic support of construction. Topographic survey and support

Correction of errors is an additional cost, the investor will not be happy. That is why they resort to the help of specialists in geodetic support of construction. This is the main reason for using their services. It's worth it. The building material will be exactly the one indicated in the estimate. All payments will pay off due to the lack of restoration measures
How child support is calculated. Formula and example for calculating child support for one and two children

Helping loved ones who cannot take care of themselves on their own is reflected in the legislation of the Russian Federation. The state created alimony as a protection mechanism for low-income relatives. They can be paid both for the maintenance of children and other close relatives who cannot take care of themselves. Read more about how child support is calculated

