2026 Author: Howard Calhoun | calhoun@techconfronts.com. Last modified: 2025-01-24 13:10:47
The Aroon indicator was developed in 1995 by Tushar Chand, an economist, technical analyst and author of books, who also created the Chande Momentum and Qstick oscillators. From Sanskrit, "arun" is translated as "dawn", which indicates his belief in the ability of this tool to predict the direction of the trend.
In day trading, strategies based on the use of this indicator are among the best. They allow you to make a profit as quickly as possible. It is one of the few technical analysis tools that can help you achieve consistent success both in trend trading and within resistance and support lines.
How the Aroon indicator works
Experienced traders are familiar with the situation when the price of an asset moves impulsively, remaining within a clearly defined range. It rises or falls only for a short period during the entire trading session.
The formula for calculating this instrument is chosen in such a way as to predict the moment when the value of an asset leaves the state of fluctuation within a limited range, allowing players to open a long or short position. It is also able to indicate when the price will stop moving and begin to consolidate.
Traders who prefer to trade in a trend can use Aroon to start trading early and exit early when the trend is about to run its course. It is interesting to note that the strategies of this technical analysis tool can also be used when trading within support and resistance levels, as they allow you to generate breakout signals.

Description
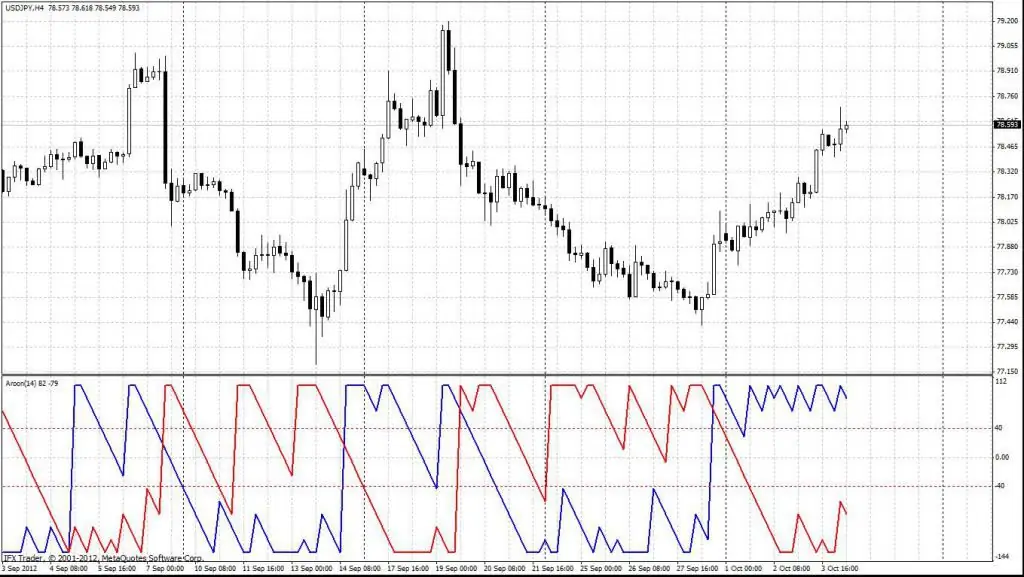
The Aroon indicator is based on two charts, which are usually located at the top and bottom of the price chart.
The formula for calculating the upper Aroon Up line is: [(number of periods) - (number of periods after the price peak)] / (number of periods)] x 100.
The Aroon Down indicator is calculated similarly: [(number of periods) - (number of periods after the low price)] / (number of periods)] x 100.
Although a trader can choose any time period to calculate this indicator, most players use the number 25 as a standard. Experts recommend using this particular strategy, as this will allow you to “synchronize” with other market participants.

Interpretation
As you can see, the indicator oscillates between the maximum value of 100% andminimum value of 0%. In principle, you can analyze the relationship between the Aruna lines and interpret the price movement as follows:
- when market trends change from bullish to bearish and vice versa, Aroon Up and Down cross and reverse;
- if the trend changes rapidly, the indicator shows extreme levels;
- when the market consolidates, the Aruna lines are parallel to each other.
Determination of trend direction
The mutual position of the indicator lines makes it easy to determine the direction of price movement. If the Aroon Up crosses the Aroon Down from below, a signal is formed that the market is about to start a bullish reversal. Conversely, if Aroon Down crosses Aroon Up from top to bottom, we can confidently talk about a potential bearish move.

However, you should not place an order to buy or sell at each new cross, because this indicates a change in the existing trend. Instead, before opening a new position in the direction suggested by Aroon, you need to wait until the price breaks the range or trend lines.
Interpretation with extreme readings
Like most oscillators, the Aroon indicator readings can be interpreted based on where its lines are located on the chart compared to the value of the respective levels it represents.
The key chart values to watch are 80 and 20 percent. If you need to knowIf the price rises, it is enough to wait until the Aroon Up line moves above the 80% level. And if Aroon Down falls below 20, then this will confirm the bullish trend. In such a situation, you should place a buy order based on the rules of the trading system.
In contrast, if you need to go short when the price breaks a support level, the Aroon indicator can be used to confirm bearish momentum. To do this, the Aroon Down chart must be below 20%, and Aroon Up, on the contrary, above 80%.

However, if one of the charts reaches the 100% level, you should always watch the market and try to protect your profit by moving your stop closer to the price. This is because the chart at 100% indicates that the trend is taking too long to develop and may be overbought or oversold and a reversal will occur very soon. This strategy allows you to use the Aroon indicator for binary options.
In a strong move, don't leave the market as a whole, because any small price correction will actually offer another opportunity to increase the position.
For example, if the Aroon Up line touches the 100% level and then drops to 90% but is still above the Aroon Down, this indicates a retracement and you can increase your long position rather than exit it. Similarly, during a downturn, you should do the opposite and try to add to your short position.

Interpretation of parallel lines
An interesting aspect of the applicationAroon indicator in day trading is the possibility of its use in markets with a limited range of prices. When the value of an asset consolidates within tight limits, the Aroon Up and Aroon Down charts are parallel to each other. Consolidation periods occur at levels below 50% when neither the bearish nor the bullish trend has sufficient strength. This is especially true when both lines of the indicator move down in unison.
For resistance and support line traders who enjoy going short at the peak of a range and going long at a support line, the Aroon indicator can help identify price consolidation zones and take advantage of this trading strategy.
If the Aroon Up and Down charts are parallel, it indicates that a breakout is about to occur.
Thus, you should always pay special attention to the price movement in the upper and lower parts of the range when the Aroon charts are parallel, as it can break the resistance line and rush in any direction. Therefore, you should be very careful.

Aroon Oscillator
In addition to the Aroon indicator, many technical analysis packages also offer an additional instrument of the same name - the oscillator. Its value is calculated by subtracting the Aroon Down value from the Aroon Up value. For example, if Aroon Up at a certain time is 100% and Aroon Down=25%, then the Aroon Oscillator will be 100% - 25%=75%. If Aroon Up is equal to 25%, and Aroon Down=100%, then the oscillator markwill be at -75%.
Often the oscillator is placed below the main Aruna chart as a separate histogram so that you can see the strength of the current trend.
If the value of the oscillator is positive, then the price makes new highs more often than new lows. Conversely, a negative level indicates the predominance of negative trends. Since the oscillator is either positive or negative most of the time, this makes it easier to interpret. For example, a level above +50% indicates a strong move up, while a level below -50% indicates a strong bearish trend.

Aroon and ADX
Experienced traders can easily see that Arun behaves like the ADX Medium Directional Index. However, it should be understood that there are key differences between them.
If you analyze their formulas, you will find that the Aroon indicator uses only one important parameter - time. The top and bottom lines represent the percentage of time between the start of the settlement period and the time the high and low prices are reached. This means that Aruna charts can indicate the strength and direction of a trend.
On the other hand, the ADX is unable to measure the direction of movement. To do this, you will need its components such as indicators of negative and positive orientation -DI and +DI.
Moreover, ADX uses a more complex formula and the ATR Average True Range Index to "smooth out" a chart that has built-in lag. Aroon Oscillator reacts fasterthe change in price action from the ADX as there are no smoothing or weighting factors in the formula.
In closing
The Aroon indicator is a great tool that every trader should have in their arsenal. It is a visual representation of the market movement that can be easily interpreted to make decisions according to price direction and momentum. You can also significantly increase the chances of a profitable trade if you build a trading technique around Aruna in combination with a breakout strategy or any other based on price movement. The indicator is very good at predicting both trends and consolidation periods, and also generates signals in combination with other technical analysis tools.
Recommended:
Trading sessions indicator for MT4. Trading platform for "Forex" MetaTrader 4

Trading session indicators for MT4 in trading is one of the most important parameters. Each time period has its own characteristics, characteristics, market liquidity and volatility. The future profitability or loss for a currency speculator depends on all these parameters. Therefore, traders and experts have specially developed tools for certain market phases and trading sessions
Trading strategy: development, example, analysis of trading strategies. The Best Forex Trading Strategies

For successful and profitable trading on the Forex currency market, each trader uses a trading strategy. What is it and how to create your own trading strategy, you can learn from this article
Momentum indicator: description, configuration and use, methods of application

The probability of trend continuation can be predicted by assessing the intensity of trading. The strength of a market movement is often referred to as momentum and there are a number of indicators designed to measure it. The Momentum indicator helps identify when players have bought or sold too much
Demarker indicator: application, description and rules of work

The Demarker indicator is a technical tool that allows traders, when used correctly, to earn money in the financial markets. It is a universal indicator for various types of trading and is the basis of many strategies. Experts and traders have been using it for decades, both in trading and in analytics. This is a fairly popular and well-known trading tool
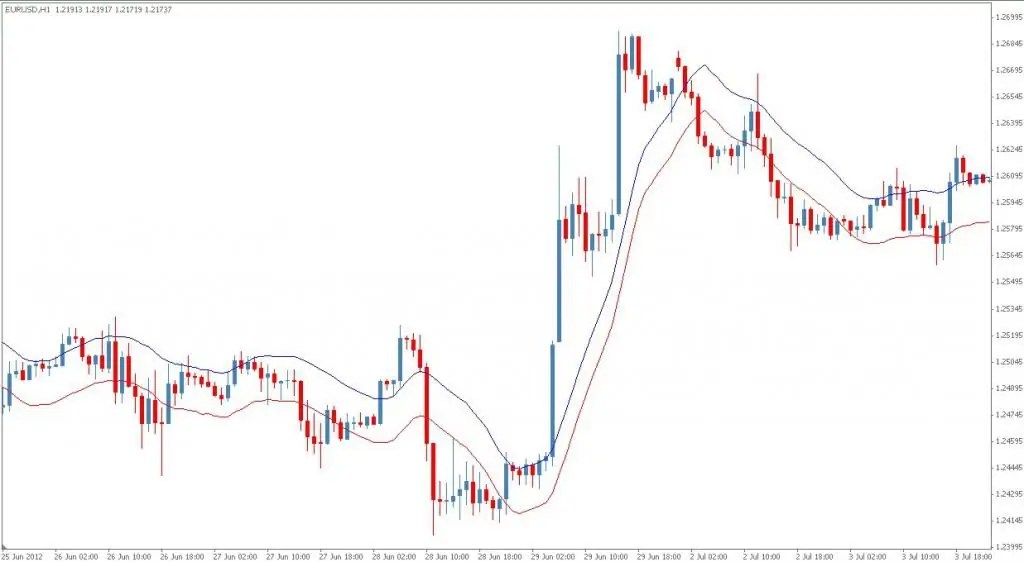
Envelopes indicator: description, required settings, application, usage strategy

The Envelopes indicator is a tool that serves to determine the upper and lower limits of the trading range. The chart of price activity displays two lines, one of which, at a distance set by the trader, repeats the moving average above, and the other below it. Along with trading ranges, this technical analysis tool is commonly used to identify extreme overbought and oversold market conditions

