2026 Author: Howard Calhoun | [email protected]. Last modified: 2025-01-24 13:10:26
To work on the financial markets, experts and trading professionals have developed a wide variety of trading tools. Many traders select individual settings in the classic types of indicators, and some develop unique algorithms on their own or order them from specialists. The Zigzag technical indicator, which will be discussed in this article, is especially popular with speculators, investors and analysts.
Description of the ZigZag tool

To make money on the financial market, each trader at the beginning of the day conducts an analytical forecast of the market movement. To identify the direction of quotes, speculators and experts use a variety of indicators, resistance and support lines, graphic figures and much more.
In order to understand in which direction to open a position, many traders use the ZigZag indicator in their work. The description of this tool will not take much time, as it looks like a broken line, whichindicates the maximum and minimum values of market quotes on the chart. Knowing the parameters of extreme points and their location, speculators apply special trading strategies for a rebound or a breakout.
Indicator settings
Before you install this tool on the chart, you need to select working parameters for it. Setting up the ZigZag indicator is quite simple and has only 3 parameters: Deviation, Depth, Backstep. With their help, the trader has the opportunity to adjust the instrument's sensitivity to various market noises and price fluctuations.

Settings "Forex" indicator "ZigZag":
- Deviation - the main function of the instrument, which is calculated as a percentage. The default value is 5%, but you can change it if necessary, as it is the minimum parameter and shows the degree of line break.
- Depth - determines the number of candles to be used in market analysis. Its default value is 12.
- Backstep - the minimum value for determining the distance between candles. The default is 3. This parameter indicates how many bars/candles will be used between quote breaks.
Pros advise beginners to use the standard settings and not change their values. For greater sensitivity of price breaks, you can choose other parameters, and then these indicators will increase and will reflect additional changes in market movements on the chart.
Featurestool
"Forex" indicator "Zigzag" is an auxiliary tool for trading, which is used in many trading strategies and market quotes analysis. Due to its simplicity, even beginners can use it in trading.
The indicator perfectly shows market price extremes and reversal points. It can be used in work with standard settings, that is, without any additional parameters. The features of the ZigZag indicator include the fact that it does not need to be downloaded from anywhere and it is available in the tools on all popular trading platforms.
Advantages of the indicator

The advantages of the ZigZag tool include ease of use and quick finding of the trend direction. With its help, during the analysis of market movement forecasting, you can cut off flat areas, interference and noise. The positive characteristics also include the fact that it can be used on any timeframes.
Besides, the Zigzag indicator is compatible with any trading systems and trading tools. It does not clutter up the chart at all and does not interfere during the analytical forecast.
Disadvantages of "Zigzag"
Unfortunately, there are no absolutely perfect instruments in trading, and ZigZag is no exception. It has two main disadvantages - redrawing market quotes and delay when using its standard versions.
Under the concept of "delay" on"Forex" implies that the instrument will follow the market price, but with some delay in real time. As a result, the ZigZag indicator processes only historical data, without looking into the future and without predicting changes in quotes. Most trading tools have such properties, such as Moving Averages, Stochastics, Parabolic and other technical indicators.
As for redrawing, it should be noted that the "Zigzag" on the chart will be displayed as a broken line and follow the market price, drawing new extremes. With the following values of quotes, it will also change the previously drawn line. This property of it follows from the delay, since it cannot predict changes in the future time, but only displays historical data. Therefore, ZigZag is one of the auxiliary tools that allow you to quickly, without any effort, determine the global trend.
It should be added that experts have developed modified versions of the ZigZag indicator without redrawing market quotes. Such tool options either completely eliminate this drawback, or they are displayed to the least extent.
Working algorithm
To understand how the ZigZag indicator works, you need to know its features. This tool independently, automatically determines the maximum and minimum values of market quotes on the chart and draws a line on them.
The essence of the work"ZigZag" is as follows - it analyzes a certain number of candles specified in its settings or by default, that is, their opening and closing indicators. As a result of calculations, he fixes the values of each candle, and eventually a line is formed. The trader sees ready-made indicator indicators on the chart. In the future, he uses these values in an analytical forecast or in trading on the financial market.
Using the ZigZag indicator in trading

In practical trading, unlike the analytical forecast, the indicator is used in different ways. This article will cover the most common ways to use the Zigzag.
Methods of using the indicator in trading:
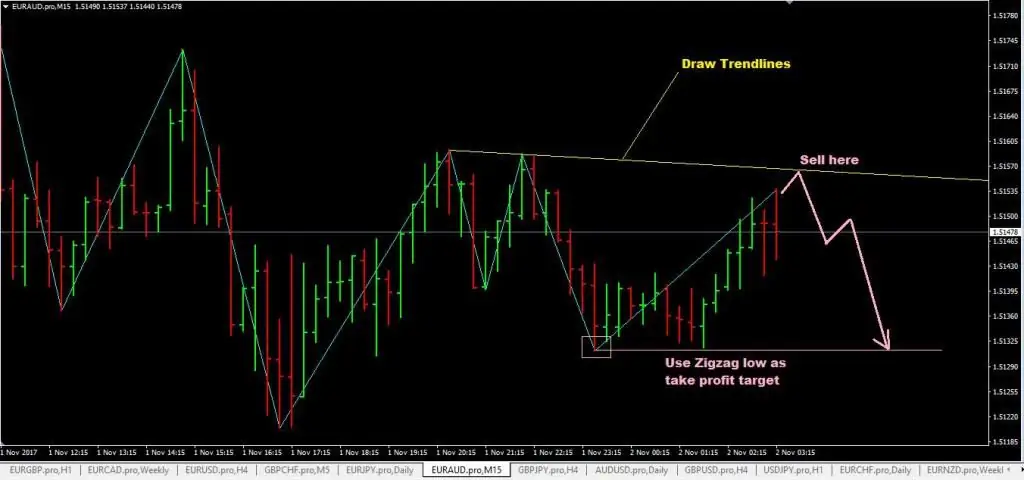
- Definition on the chart of levels. The stronger these indicators and the more accurate the signals from the ZigZag, the more chances for traders to earn. Important price levels such as support and resistance are used in various trading strategies as well as in forecasting. They are carried out on the breaks of the indicator indicators, the upper line is resistance, the lower line is support. MetaTrader has a special tool called the "horizontal line" with its help, just such levels are drawn.
- Building impulse and trend lines. With the help of the ZigZag indicator, this can be done very quickly. It is enough to install the tool on the chart, it will draw the line automatically, and the trader will be able to determine which one is on the market.there is a trend.
- Designation of patterns of reversal or continuation of the impulse. Using the indicator, you can identify graphical patterns that allow you to understand the immediate prospects for market movement.
- Zigzag indicator and Fibonacci levels. Sometimes in trading there are situations when, after setting the "Fibo" on the chart, it is impossible to determine where to draw the "grid" from. The "Zigzag" will help to build it, which will indicate the desired extremum for the Fibonacci levels.
Indicator signals

As mentioned above, using ZigZag, you can find candlestick patterns and figures on the chart. Consider the most common options that most often appear on the charts:
- Graphic figure "Head and Shoulders". Beginners cannot always quickly determine, and in Forex it is very important, a market reversal and a trend change. With the help of an indicator that marks the lines by extremums, this task is greatly facilitated. The characteristic of the "Head and Shoulders" pattern is the extremum indicated on the chart, followed by a larger top, which is also found by the "Zigzag", and a third smaller top.
- Double top graphic figure. On the chart, it looks like two extremes, which are drawn by the ZigZag indicator.
- Double bottom pattern. By and large, this is an inverted "Double Top".
And also appear quite often on the chart"Triple top" and "Triple bottom". In total, there are several dozens of the most diverse graphic shapes, but these options are easiest to determine using ZigZag.

Besides, the signals indicated by this tool can be based on candlestick patterns, for example, "Pin-bar" appearing at the peaks of market quotes. Or in combination with Fibonacci levels, when the indicator draws rebounds from Fibo levels at 38.2, 50, 61.8. For traders, especially beginners, this is very convenient, as the confusion on how to trade disappears. The ZigZag indicator eliminates the emerging subjective approach of a trader when analyzing the market.
Instruments for trading based on "ZigZag"
Modified versions developed by experts on the basis of "Zigzag" significantly reduce or completely eliminate its main drawback - the redrawing of market quotes. There are several effective trading tools:
- Indicator "Gann Zigzag". It is based on the algorithms of 2 tools - ZigZag and the Gann fan, or in some modifications a "grid" is used. This option allows you to more accurately filter out false signals and open positions with a higher probability of earning on Forex.
- ZigZagger 2.0 indicator. This tool has a built-in sound alert function, and it indicates the signals for opening orders on the chart using an arrow taking into account the direction. This indicatordoes not redraw, but is also not a Grail for opening positions, since the signal can change its values. Therefore, it is recommended to use any version of ZigZag-based indicators, even modified ones, with other instruments.
- ZigZag triad. It allows you to automatically build support and resistance levels. Its peculiarity is that, working on ZigZag algorithms, it does not designate levels in the usual way, like lines, but displays them on the chart as dots. It is used by traders as a convenient way to place protective orders, and is also used in trading strategies to break through support or resistance.
Trading strategies with ZigZag

The simplest techniques that beginners can use is to work with strategies to rebound from levels or break them. To trade, you need to install only two technical indicators on the chart: "Zigzag" and moving averages with a period of 14, which will indicate the direction of quotes movement.
The essence of working on strategies with the ZigZag indicator:
- Select the reversal or rebound area by the bends of the broken lines of the instrument.
- Use pending orders to set a position to buy or sell, depending on the market situation.
When the market is in a calm state, then trading takes place in a sideways range from resistance to support and vice versa. During trends, you can work on a rebound from levels when the market reacheshigh/low values or trend, breakout.
Forecasting changes in market quotes with "Zigzag"
For effective trading, the "Zigzag" tool must be used in combination with other types of indicators or graphic constructions. In the analytical forecast of the market movement, it is used with the following technical indicators:
- MASD.
- "Parabolic".
- "Stochastic".
- Moving averages.
- "Alligator".
- Relative strength index and other types.
In addition, it can be used as a confirmation in candlestick market analysis, with Fibonacci levels, a Gann fan, Bollinger bands, and also build resistance and support levels based on the ZigZag indicator.

Conclusion
ZigZag is a great assistant for a trader that allows you to quickly analyze the market condition. With its correct application, you can get stable positive results in trading.
Recommended:
Work at Magnit Cosmetic: employee reviews, working conditions, job responsibilities and features of the work performed

Prospect of career growth is one of the tempting promises of employers. According to the feedback from employees about working at Magnit Cosmetic, here you can really reach certain heights in just a couple of years, starting as a sales assistant and becoming the director of one of the chain stores. Is it true or not? Let's try to find the answer to this and many other questions
Work permit for work in electrical installations. Rules for work in electrical installations. Work permit

From August 2014, Law No. 328n comes into force. In accordance with it, a new edition of the "Rules on labor protection during the operation of electrical installations" is being introduced
Protection devices: purpose, types, classification, specifications, installation, features of operation, settings and repair

Protection devices are currently in operation almost everywhere. They are designed to protect both electrical networks and electrical equipment, various machines, etc. It is very important to properly install and follow the operating rules so that the devices themselves do not cause a fire, explosion, etc
ADX indicator. ADX technical indicator and its features

ADX-indicator is a unique trading tool that allows you to determine the strength of a trend. It gives clear signals to traders about the time to enter and exit the market
Envelopes indicator: description, required settings, application, usage strategy

The Envelopes indicator is a tool that serves to determine the upper and lower limits of the trading range. The chart of price activity displays two lines, one of which, at a distance set by the trader, repeats the moving average above, and the other below it. Along with trading ranges, this technical analysis tool is commonly used to identify extreme overbought and oversold market conditions

