2026 Author: Howard Calhoun | [email protected]. Last modified: 2025-06-01 07:12:56
ADX-indicator is an indicator of directional movement. Its main purpose is to assess the momentum of the trend. It is also known among traders as the Average Directional Index. The technical analysis tool allows you to determine the strength of the movement and assess how strong the momentum of the "bulls" or "bears". ADX is already built into the underlying trading platforms MT4 and MT5.
What does the indicator look like?
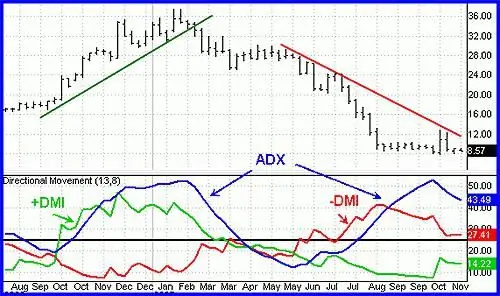
If you install the indicator on the chart of the currency pair that you plan to analyze, you will see three lines in the lower window: the main blue, pink and green dotted lines. The main blue line shows the strength of the trend. The higher its location, the more market participants push the price in a certain direction.

If the line is below 20, the strength of the trend is very small. When the range between 20 and 40 levels is reached, the strength of the movement is medium, if the line crosses the 40 level, the price movement is characterized by the presence of a strong impulse either from sellers or buyers.
What does the indicator say?
Dashed lines indicate bearish or bullishmarket sentiment. The green line is conventionally designated "+DI". When it is located above the other two lines, the price rises. If a pink dotted line runs along the top, conventionally denoted as “- DI”, the market is in a downtrend. A trend change occurs when the lines intersect. It is on the basis of these two lines that the ADX indicator is calculated. The description of the instrument allows you to consider several profitable entry points:
- If the main line of the indicator (blue) is located between the +DI and - DI lines, while it indicates an upward direction, then this indicates an increase in the upward trend, and purchases can be considered. If the direction of the line is reversed, we are looking at sales.
- When there is a strong trend in the market, and the ADX-indicator is located above the auxiliary lines, it is worth taking into account that the trend is already close to an end and it makes no sense to open any deals. If there are open positions, they should be carefully monitored. You need to close orders when the main line goes actively down.
Main recommendations for using the indicator

Not all Forex indicators can give a signal to buy or sell, but ADX is one of those tools that predicts rather than analyzes the situation after the fact. If the market is flat, and all instrument lines are tightly intertwined with each other, it is better to stop using it and give preference to one of the oscillators. With the help of lines, you can determine the strength of the future trend. Worth payingattention to the aspect that the indicator cannot indicate the direction of the trend, it can only indicate its presence in the market or its absence. With a "bearish" trend, the line may be directed downward, and this will indicate precisely the presence of a strong and impulsive movement. If the "bulls" prevail, the line will be directed upwards. The efficiency of trading will increase dramatically if you use 2-3 trading indicators at the same time, including the ADX indicator. How to use it, we examined a little higher.
Tool versatility

The main advantage of ADX is its effectiveness on different timeframes. If identical signals are received from a trading instrument over several time periods, you should think about opening a position, having previously assessed the situation on the market. The tool is applicable to intradays and swing trading. In the latter case, the use of the indicator in the period from one to several days is recommended to pay attention to the results of the last trading sessions. It is desirable that in the trading range the main line of the Average Directional Index cross the trading level 40 as high as possible. For the convenience of assessing the situation, you can set the levels in the instrument settings.
How to combine a trading indicator with a trading strategy?
The indicator can be successfully integrated into any trading strategy. It is not recommended to use it on its own, but in combination with other tools and with confirmation by secondary signals, it can provide a decentprofitability for the trader.

Let's consider what instruments experienced traders combine the ADX indicator with. The strategy involves opening a position when one of the signals described above takes place near a key level or in the structure of a technical pattern (technical analysis figures). The lines of the instrument work well in combination with candlestick analysis patterns. For example, if a pin bar has formed on the price chart, which indicates a trend reversal, and the main line of the indicator has been intertwined with other lines below level 20 for a long time, you should prepare for a significant price drop and a very strong impulse. And if this picture is supplemented by economic factors of fundamental analysis, you should prepare to open a profitable deal.
Correct positions
For trading on any of the timeframes, the standard setting of the ADX indicator is suitable. Traders who work exclusively with technical analysis can customize the program to suit their needs. There is already a personal matter for everyone, but it is preferable for beginners not to change anything in the settings and leave everything as it is. It is permissible to enter a trade even when, with a clear trend, the indicator line crosses the level of 30. It is worth opening a position with a small lot.

At the moment when the blue line crosses level 40, you can top up. To determine a more accurate entry point, it is worth switching to smaller ones on the eve of making a decision.hour charts. This will reduce the ratio of loss and profit, will allow you to win back the deal in the best way.
ADX for risk reduction

ADX-indicator can be successfully used with relatively weak market movement, but with its actual presence. To avoid a series of stops on a number of transactions, you can be guided by the location of the lines. For example, if the price is actively moving towards the level and is ready to break it by all indicators, but the indicator indicates a slowdown in the trend, you should not enter the market. The strength of the "bulls" or "bears" is simply not enough to continue the movement. Taking into account the readings of the lines and their location relative to the levels, the number of losses as a result of fake breakouts will significantly decrease.
How to determine the period of consolidation in the market and refrain from trading?
ADX-indicator can become an excellent indicator of market consolidation. It is very problematic to independently determine the fading of the trend and the transition of the market to a flat. If the trend along the three lines is downward, we pay attention that it is problematic to call the situation favorable for trading on the market. A systematic decline from the level of 50 to the bottom warns of low volatility. If trading is based on breakouts and bounces, then the lines crossing the level of 40 can be interpreted as the beginning of an active trend and the end of a period of stagnation on the exchange.
Explosive mixture of ADX and MACD
Considering Forex indicators, it is worth saying that ADX is most harmoniously combined with MACD. If installed onthere are two instruments on the chart, they will exclude false signals from each other. When ADX indicates the presence of a strong movement in the market, the MACD indicator is able to show the direction of this very movement. This will eliminate the confusion and difficulties that traders face when just starting to trade using this tool. Quite often, due to inattention, a blue line that has risen up is associated with a growing trend, and a falling one is associated with a falling one.

The simultaneous growth of two indicators can serve as an excellent signal to buy. When both indicators go down, this indicates the fading of the movement, MACD, in turn, heralds a trend reversal.
Lagging behind is one of the main disadvantages of the ADX indicator. The description of the problem is very simple. The bottom line is that the indicator correctly gives a signal about the strength of the trend only when the reversal (flat) itself does not drag on for a long time. The problem is that the history of the existence of a certain trend, on the basis of which the chart is plotted, is erased very quickly. Data analysis can be skewed. This implies the fact that it is rational to use indicator signals only at the very beginning of the trend, at the moments when the three lines of the instrument practically lie at the lower level. The longer they stay in this position, the more profit you can count on.
Recommended:
Technical water: features, norms and quality categories

Technical water is used for the production of finished products, in the technological process, and also as the main working component. In total, there are three types of such water: distilled, pure and special purpose
Belleville spring: purpose and technical features

Belleville spring is able to withstand enormous loads with very little deformation. About what materials it is made of, how it is assembled and where it is used, will be discussed in this article
Technical passport for home: how and where to make? Terms of production of a technical passport for the house

One of the main documents related to real estate is a technical passport for a house. It will be needed to carry out any transaction, and is manufactured at the BTI at the location of the facility. How much does it cost, what documents need to be collected, as well as the validity of the registration certificate and other nuances in more detail in the next material
Technical carbon, its production

Carbon black (GOST 7885-86) is a type of industrial carbon products used mainly in the production of rubber as a filler that enhances its useful performance properties. Unlike coke and pitch, it consists of almost one carbon, it looks like soot
Technical analysis of "Forex" (market). What is the summary technical analysis "Forex"

The Forex market has become very famous in Russia in a short time. What kind of exchange is this, how does it work, what mechanisms and tools does it have? The article reveals and describes the basic concepts of the Forex market

